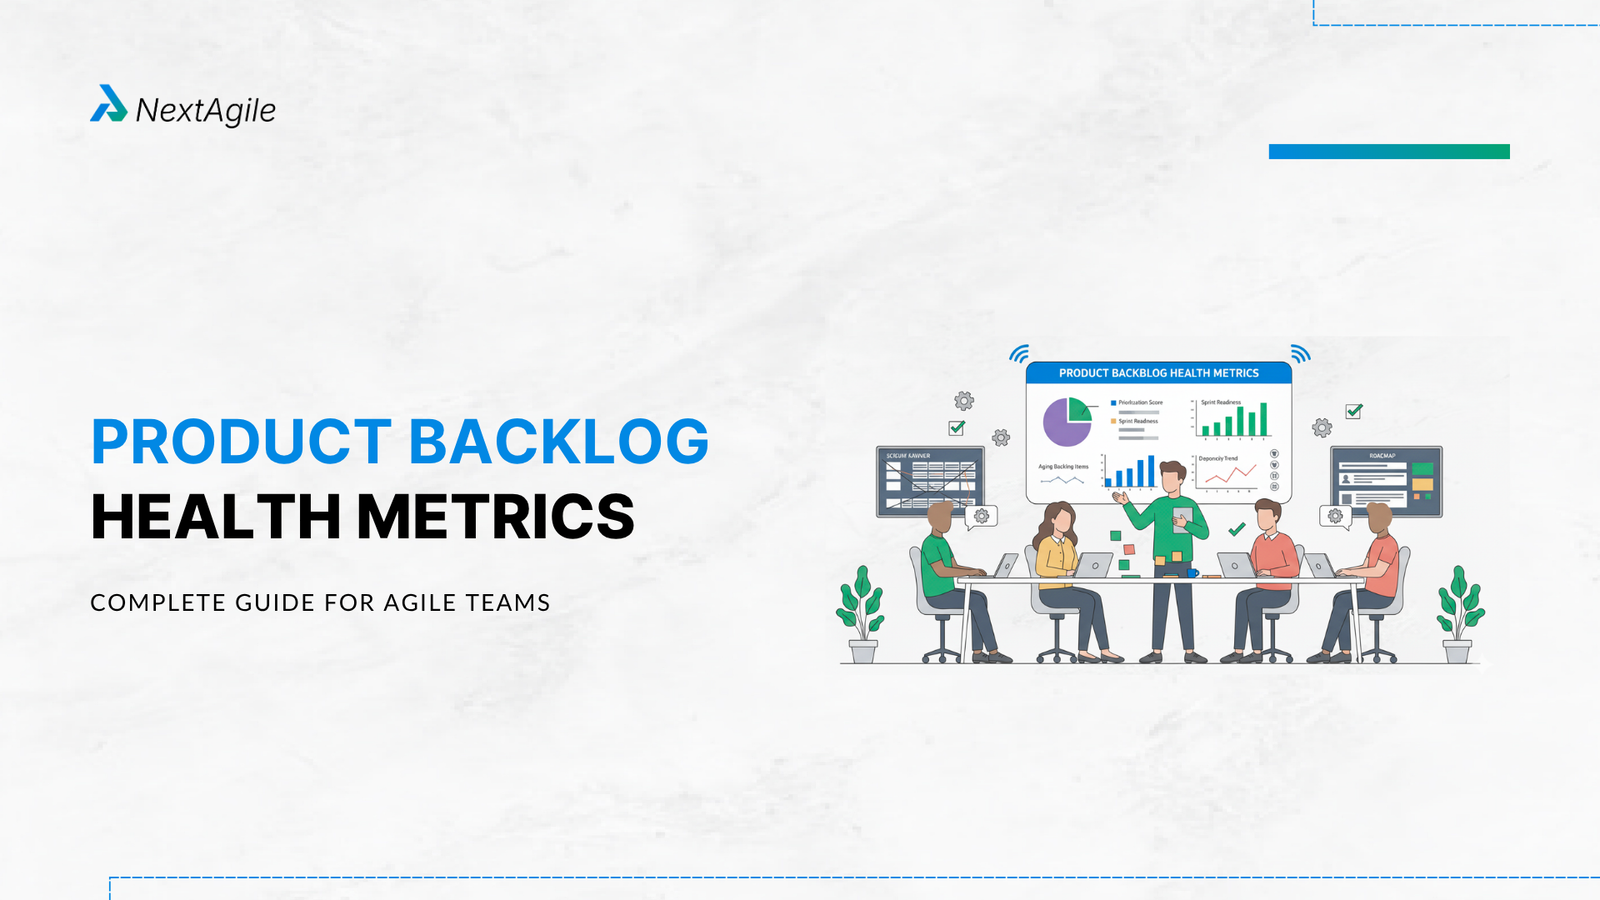
Product Backlog Health Metrics: The Complete Guide for Agile Teams
Anuj Ojha
Talk to Expert for Free
Table of Contents
Key Highlights
Product backlog health metrics are quantitative indicators that measure how well your backlog enables predictable, value-driven Agile delivery.
The 18th State of Agile Report (2026) found that 53% of organisations struggle to prioritise the right work and 76% face increased ROI scrutiny on Agile investment, both of which are backlog governance problems, not execution problems.
The Easy Agile State of Team Alignment 2026 report found that 44% of teams report tasks ending up significantly larger or smaller than estimated on roughly half their work, a direct signal of poor backlog sizing discipline.
The 8 core metrics span clarity, aging, size, readiness, dependency health, churn rate, technical debt ratio, and business value density.
NextAgile embeds backlog health metric frameworks into every agile transformation consulting engagement across India and GCC.
Introduction
Velocity tells you how fast your team is running. Product backlog health metrics tell you whether they are running in the right direction with the right fuel. Most Agile teams track only velocity and burndown, which are both lagging indicators. By the time these metrics show a problem, the backlog issue causing it has already been active for one to two sprints.
The18th State of Agile Report (2026) found that more than half of organisations struggle to prioritise the right work (53%) and track business impact (52%), and that 76% now face increased scrutiny on the ROI of their Agile investment. These are not execution problems. They are backlog governance problems. Teams that measure and act on product backlog health metrics close this gap faster than teams that focus on output metrics alone.
This guide covers the 8 product backlog health metrics that matter most, what each one measures, what healthy benchmarks look like, and how to collect them without adding tool overhead to your team’s week. Read this alongside ourproduct backlog refinement guide for a complete picture of how measurement and process reinforce each other.
Why Product Backlog Health Metrics Matter in 2026
TheAgile State of Team Alignment 2026 report, which surveyed 419 engineers and product managers, found that 44% of teams report tasks ending up significantly larger or smaller than estimated on roughly half their work. That estimation accuracy gap is a direct symptom of poor backlog health metrics tracking. In our agile consulting engagements across enterprise clients, poor backlog health is one of the most consistently misdiagnosed problems. Teams see missed sprint goals and assume the team is underperforming. When we run a backlog health audit, we find the team is working hard on the wrong things, or on things that were not ready to be worked on at all.
Three specific business risks appear when backlog health metrics are not tracked: predictability collapse, stakeholder trust breakdown, and technical debt accumulation beyond recovery capacity. All three are preventable with a simple, consistent metrics cadence. Ourfuture of enterprise agility guide shows how AI-driven backlog analytics are becoming the next frontier for teams that have mastered manual measurement.
The 8 Product Backlog Health Metrics
1. Backlog Readiness Rate
Definition: The percentage of top-sprint stories that meet your team’s Definition of Ready before sprint planning begins. Healthy benchmark: above 80% for the next two sprints. Below 60% signals a broken refinement process. Track weekly before sprint planning. Low readiness rate is the single strongest predictor of sprint planning overruns. Ourproduct backlog refinement guide includes a Definition of Ready template you can adapt in one refinement session.
2. Backlog Item Age
Definition: How long each backlog item has existed without being started (in calendar days). Healthy benchmark: fewer than 20% of items older than 90 days; fewer than 5% older than 180 days. Review monthly in a backlog audit. Items older than 180 days cost 2 to 4 hours of context-switching when finally pulled. Use your agile project management tool’s creation date field to automate age calculations and surface stale items weekly without manual exports.
3. Backlog Size to Velocity Ratio
Definition: Total story points in the backlog divided by average sprint velocity. Healthy benchmark: 6 to 12 sprints of work. Below 4 means planning risk. Above 24 means prioritisation failure. Understanding youragile estimation techniques is a prerequisite for making this ratio meaningful, because inflated story point estimates produce a ratio that looks healthy but is not.
4. Story Size Distribution
Definition: The percentage of top-20 backlog items sized above your maximum deliverable size threshold per sprint. Healthy benchmark: zero stories above 8 story points in the top two sprints. Size every item in the top 20 during refinement. Flag anything above your threshold. Split before sprint planning.
5. Dependency Flag Rate
Definition: The percentage of backlog items in the top 20 that have at least one open, unresolved external dependency. Healthy benchmark: below 20%. Above 40% indicates a systemic architectural or team structure problem. The Agile State of Team Alignment 2026 report found that cross-team dependency visibility is one of the top three causes of sprint rollover across enterprises. Tag dependency items in your backlog tool and review weekly in the PM sync or Scrum of Scrums.
 Skip to content